.png)
- Dr. Karsten Schulz
- Mar 4, 2020
- 3 min read

Artificial Intelligence is a bit of a mystery. We feed data into some magic algorithm, which then drives a car, manage a supply chain or decides if something we write is nice or offensive.
But how does it work?
To investigate, we thought that many of us know how to work with Excel™, so we said, "how hard can it be to export an Artificial Neural Network into an Excel spreadsheet?". And that's what we did.
To keep things simple, we decided to make a very small ANN in the MyComputerBrain online platform that consists of just nine perceptrons (neurons). It is very basic, but it can determine if the majority of three input fields are either white or black. Not bad. We then trained the ANN and generated the spreadsheet file. If you'd like to tag along, you can find it here.
The first image shows the ANN in the browser window:

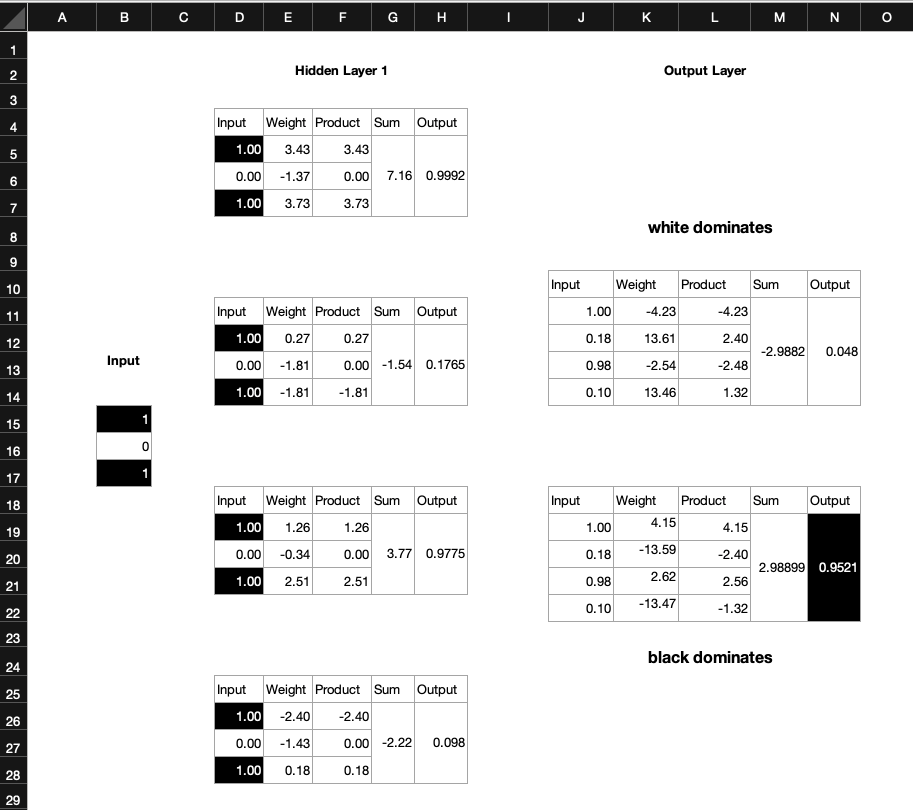
And here is the corresponding representation in spreadsheet format.

The spreadsheet AI has one out of three inputs black and two are white. Correspondingly, it shows at its output the white dominates.
If we now switch a second input to black (value =1), then the output flips to 'black dominates'.
We can try this out with all possible combinations of black and white inputs. The AI is properly trained and will give us the correct result.
Note a couple of interesting things:
The output will never be exactly 1. Yes, it will be close, like 0.9521, but never 1.
The spreadsheet does not contain any IF-statements in the form IF (B15==1) AND (B17==1), THEN N19=1. That's because we haven't programmed the scenario into the spreadsheet. All that we've done is exporting the weights and the math that links the fields together.
But does it work? Select the cell D5 in Excel™. Note that it links to B15. So the input of the hidden layer comes straight from the output of the input layer. Confirm this with the other hidden layer input cells D6, D7, D12, D13, D14, etc.
The weights in the perceptrons are all constants. They came out of our browser AI and are the result of the learning process. Our Spreadsheet AI uses them.
The product cells are the simple product of input and weight. E.g. F5, F6, F7. for the first hidden layer perceptron. In each perceptron, the products get summed up, and you find them in cells G5, G12, G19, G26. Each sum is then pushed through a Sigmoid function (see below) in H5, H12, H19, H26, which produce the output of each perceptron. These outputs are then used as inputs of the next layer, the output layer perceptrons. Note that each output layer perception has four inputs (one for each hidden layer perceptron). If this sounds confusing, just look at the arrows in the browser AI.
Each of the output perceptrons then does the same thing that each hidden layer perceptron did: Multiplying the input with the weight factor (product), summing up the products and pushing them through the Sigmoid function.
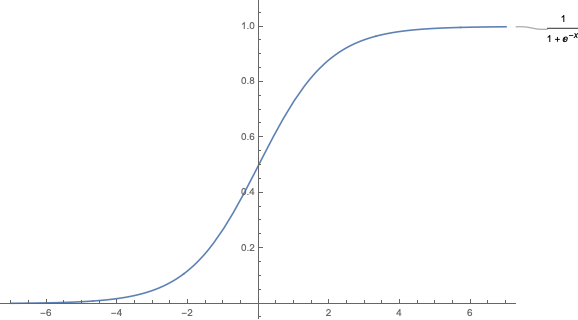
At this point you might ask yourself how the Sigmoid function looks like. Let's plot it. Note that the output of the function approximates 0 and 1, but it will never reach those values. Now you understand why the output of our AI can never be exactly 1.
If you like, you can play with the weight factors. Go and change them and observe when the spreadsheet AI will become erratic.
Every perceptron contributes a tiny little bit to the overall solution. If you like, you can change the formulae in the input layer and exclude some perceptrons from the calculations. Your AI might still work. I have just removed the third input of the first perceptron in the hidden layer (highlighted in red) and the Spreadsheet AI still thinks that the black fields dominate, which is correct. Note how the output value has slightly decreased from 0.952 to 0.9459. Our AI is a little but less certain.
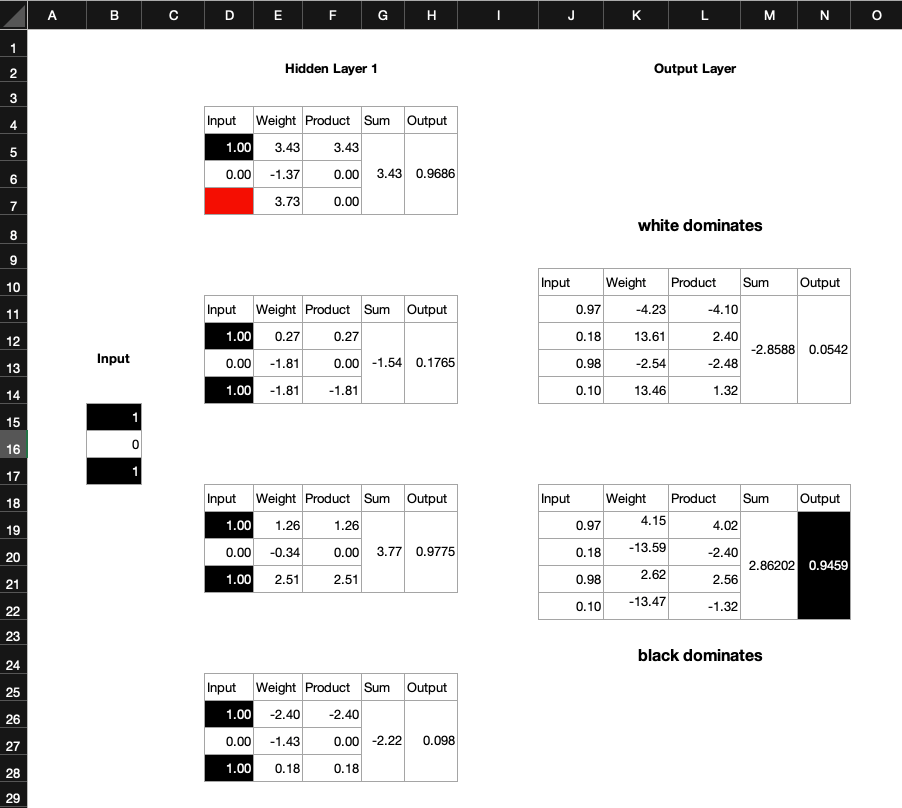
Now we perhaps understand why brain surgeons can remove parts of a (human) brain and the patient is still able to function. In our little surgery here in this blog, we have essentially severed a synapse.
But let's go back to the beginning. The 'magic', if we want to call it that, in an artificial neural network is the arrangement of the perceptrons, their interconnectedness and the weight factors, which are the result of a learning process, called back-propagation. How we get to these weights is going to be the result of a separate blog. For now, I hope this one has shed some light on the inner workings of a tiny AI.
Let me know what you think.
Until next time,
The Doctor.
Acknowledgements. We'd like to thank the Digital Technologies Hub for their contributions to the inspiration of this scenario.
- Dr. Karsten Schulz
- Feb 19, 2020
- 1 min read
At the Digital Technologies Institute are very excited to be part of the EdTech4Future's Digital K-12 Classroom summit 2020, which comes in an online format. With 50 global speakers and over 7,000 attendees already registered, there will be 3 days of live streaming. You can reserve your spot for this live event via this link
In my session, I will be talking about AI in the classroom and how accessible it is with local resources, ordinary laptops and small data sets.
There will be many examples on display, such as how AI can be used:
against cyberbullying,
for mathematical curve fitting for science experiments,
to help students understand learning strategies and the positive effects of revision on their brains increasing knowledge retention.
I also talk about other AI resources, such as lesson plans that teachers can find on the Digital Technologies Hub.

Hope you can make it.
The Doctor.
- Dr. Karsten Schulz
- Dec 4, 2019
- 4 min read

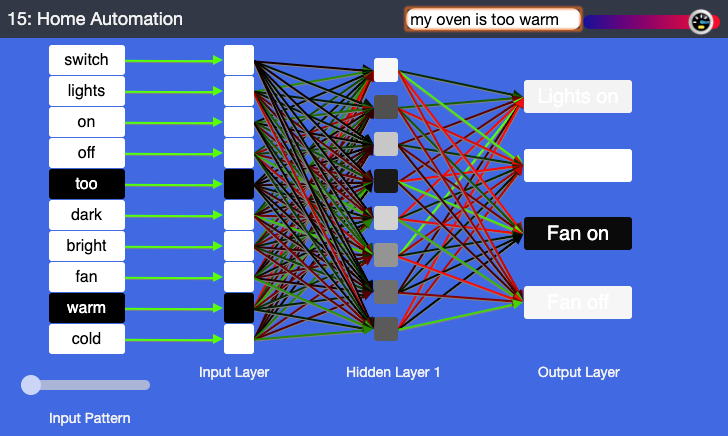
Home Automation is all the rage. You talk to your mobile phone to control the lights, the fan, the air conditioner, or your pool pump. But how does it work? In this lesson, we explore the AI that could power a home automation system.
Let's consider a simple artificial neural network that takes a range of input commands and turns them into decisions to turn the lights or the fan on or off.
You can follow these steps along by opening the application MyComputerbrain in a separate browser window.
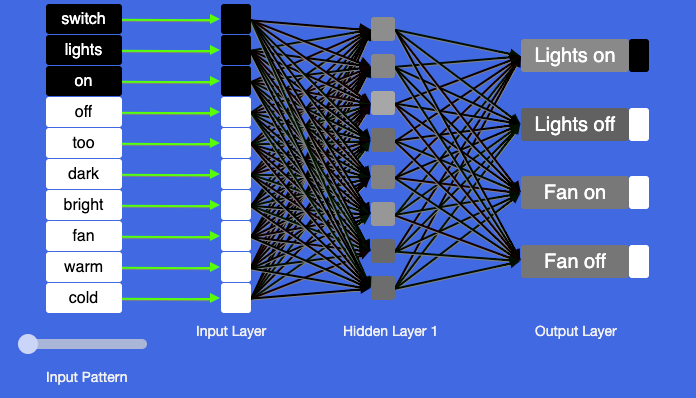
The image above shows the view in the application. On the right, we see the actions that our home automation system can execute. It can turn the lights on or off, and the fan on or off.
On the left hand side we see all words that the ANN is able to understand. The three black boxes ‘switch’, ‘light’, ‘on’ represent one set of training data. Drag the slider above the words ‘Input Pattern’ to see all training data. In between the input and output is an artificial neural network (ANN). The boxes in the input, hidden and output layer are called Perceptrons, corresponding to neurons in the brain.
Training the network
Before we can use the network, we have to train it first. Let's run the training process by clicking on the start learning button in the top right corner of our screen

The training data will be shown to the AI and it will make a series of repeated improvement attempts until the error of the network falls below a preset threshold. This process is called backpropagation.

The dial at the bottom-right will eventually turn green when the training process is complete. The network is now trained.
In this scenario, we use text input, but it isn't hard to imagine how a speech to text module would listen to verbal commands and convert them into text, or, alternatively, provide the audio directly to the ANN. We use text here, because of its simplicity.
Let's now enter a command for the AI to analyse. We could try my oven is too warm. Note how the AI is initially unsure about what to make out of 'my oven is', but then the words 'too warm' lock in with the AI's knowledge base. The result is that the fan gets switched off.
Let's assume you enter a room and you say just 'lights'. Most of us would want the lights on. This is an interesting case, because the word 'lights' is used both in conjunction with turning lights on and off.
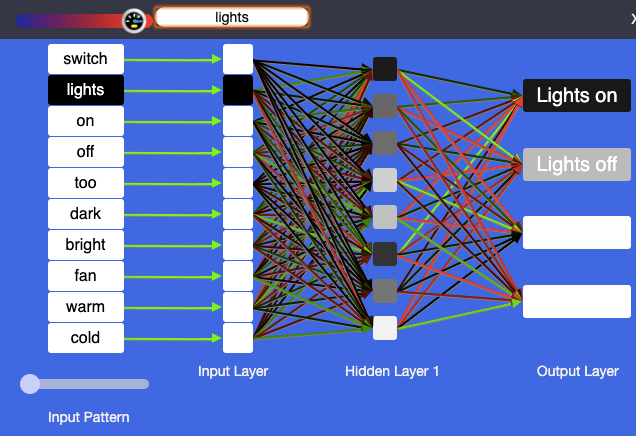
Interestingly, the AI agrees with our human notion of 'lights' and decides that turning on the lights is the right decision over and above turning the lights off. Notice how the 'Lights on' output is firmly black whilst the 'Lights off' block is grey. This is an indication of how confident the AI is. Hover your mouse over the blocks to see inside.
Try to find a scenario that turns the fan on and the lights off!
In the experiment, the scenario and the training data were fixed. This is suitable for younger students and beginners. However, you can level this up and give students a freer reign over the scenario and training data.
In the following experiment you can build a simple home automation system that can do any four different things at your command.
Discussion & Reflection
Exploring the necessary elements of home automation, let's consider the main components of common digital systems and how they may connect.
Input: What forms of human input might a home automation system process (speech, written text, gestures, …)?
Decision-making: How might a home automation system process the human input in order to come to a decision about what needs to be done?
Output: How might a home automation system turn the decision into a physical action? This refers to what is called actuators, such computer-controlled electronic switches or motors.
These three aspects of a home automation system are very suitable to cover a range of content descriptors in the Australian Curriculum:Digital Technologies. Consider flow charts or any other form of diagrammatic representation to conceptually explore sequences, branching and iterations. The purpose of this step is not to write any code, but to explore and visualise possible steps and actions that might occur in home automation system. This task also provides an opportunity to discuss scientific ideas about electrical systems and how they are controlled using a digital system.
Our activity explores the above steps 1 (input) and 2 (decision making). For 3 (output) via physical actuators, a separate activity can be undertaken with Arduino, Raspberry Pi, or BBC micro:bit activities that demonstrate how code drives actuators.
The lesson plan for this activity, jointly developed by the Digital Technologies Hub and the Digital Technologies Institute, is now available. It can be accessed on the DT Hub Website.
Let us know what you think.
Until next time,
The Doctor.
Acknowledgements. We'd like to thank Apps For Good, UK and the Digital Technologies Hub for their contributions to the inspiration and refinement of this scenario.


